Sunday, March 24, 2024

Stopping By Woods on a Snowy Day


line of people outside a building, US flag, snow

It seems I'm always ready for March to bring Indian Creek Nature Center's annual maple syrup festival, even when the last two months in the Midwest hardly qualified as winter. Then Friday came a surprise snowstorm, thick goopy stuff that arrived so suddenly the schools didn't have time to cancel classes. It was already melting by Saturday, but enough remained to lend some scenery to the pancakes and sausages. The Nature Center estimated Sunday that 2700 people came through the lines over the course of the weekend, which means the staff and volunteers served at the rate of 300 people an hour!

"Breakfast Line" sign
This way to the pancakes!


cooks and griddles under a canvas tent
Hard at work over the griddles

pancake/sausage serving line, woods and snow in background
Waiting for the next batch: Untimely equipment failure
created some brief backlogs

volunteer pouring sausages into tray
Refilling the sausage tray

It all plated nicely.
Syrup was made from the Nature Center's own trees.
Coffee donated by Caribou

Most of our party had seconds, which encouraged an after-breakfast hike:
snow and woods, shadow of a bridge
Woodland Trail view


Along the trail:
The old Bertram Road bridge has been repurposed

Amazing Space building

McCarty Wetland

On a chilly morning, few if any people had their pancakes outdoors. There was plenty of room inside in the main hall, where we sat and where there was musical entertainment. People used the classrooms, too, where the ambience doubtless was quieter. We saw a few people we knew, and a lot of people we didn't. What a great place to see your community!

There were also demonstrations of syrup-making down the road at the former Nature Center space.

For the Nature Center, greeting 2700 happy pancake eaters, not to mention mobilizing two days' worth of volunteers, is a good way to promote the many ways it provides value to the community: trails, programs for all ages, acres of wild space, and modeling ecological living. I love the Nature Center, but I confess there are years where I go from maple syrup festival to maple syrup festival without ever getting back. It's good to be reminded that it's here, every day of the year, and doing a lot of good work.

This is particularly important as our warm winter signals the steady accumulation of climate change. I enjoy a clement day as much as anyone, but the last nine months have been the warmest on record worldwide, the oceans have never been this warm in human history, winters are getting warmer, and springs are getting earlier. Something is going down, something that we have only a partial notion of, and it's not going to be pretty. Or clement. It's messing with syrup production, too: this year Nature Center trees produced only 500 gallons of sap (last year they got 2000); the variability affects private producers, too, like Danno Potter of Garnavillo, who told the Cedar Rapids Gazette: It puts a lot of pressure on us. We can't be wrong.... I drink a lot of coffee in the morning thinking how I can (adapt) (Miller 2024). Coffee's going to be affected, too, of course! The Nature Center crowd knows all this, or most of them do anyway. They know we have to live with and in nature, not just put it on our pancakes, and even in a town where you can get anywhere in a car in 15 minutes.

Speaking of which, the Nature Center's remote location has given it room to expand in a genuinely unspoiled area, and to develop an impressive range of hiking trails on its large campus, but it's difficult to get there without a car. (This is shown by the jaw-dropping spread of parked cars during Nature Center events. Cars are bigger than people, of course.) As our metro trail network gets fleshed out, it will be easier to get there by bicycle, at least in the warm months. It's almost three miles from the nearest bus stop, at the Mount Vernon Road Hy-Vee, and there's far from being enough potential traffic to warrant extending the #2 line out this far. It's a conundrum.

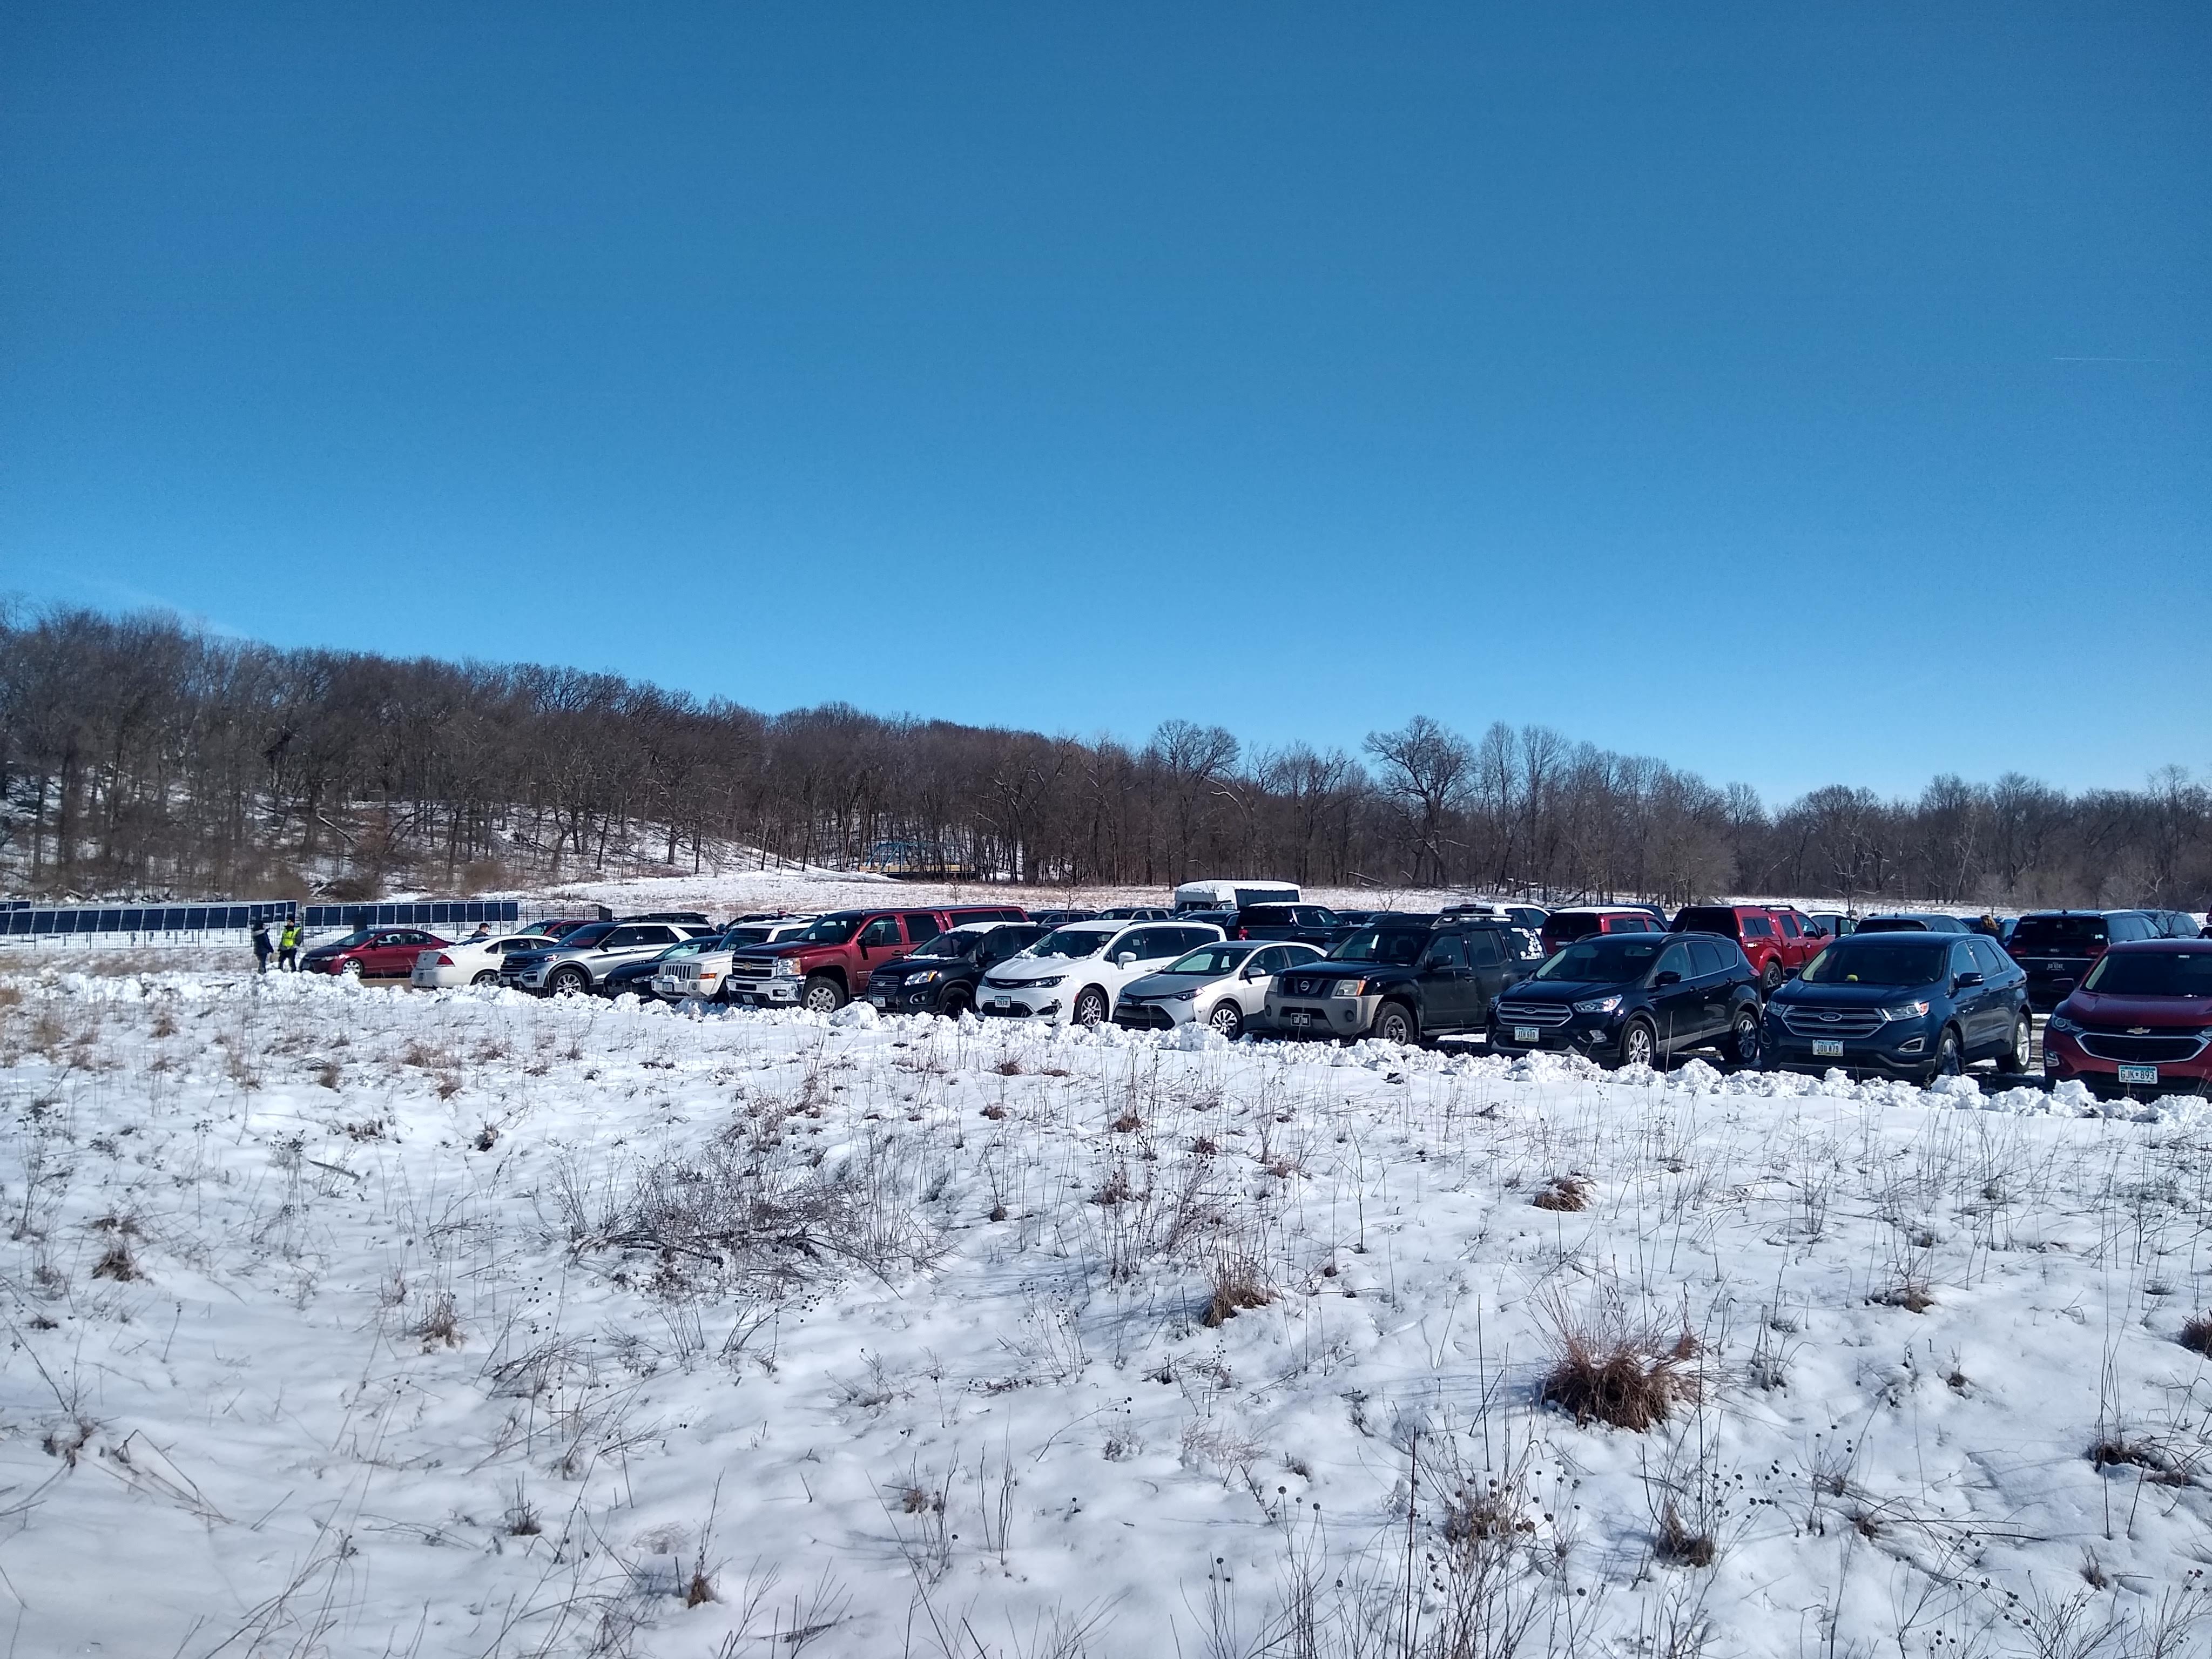
Getting all those people there required a lot of cars

Indian Creek Nature Center is on Facebook and Instagram and in the blogosphere. Not on Mastodon, yet, however.

SEE ALSO: "Maple Syrup Festival 2023," 26 March 2023


Saturday, March 16, 2024

Human transit in the Twin Cities


front view of light rail train car
Green Line departing East Bank stop

Jarrett Walker, Human Transit: How Clearer Thinking about Public Transit Can Enrich Our Communities and Our Lives (Island, revised ed, 2024)

Jarrett Walker is out with a new edition of Human Transit, first published in 2011. Walker is a transportation planner, consultant and blogger from whom I've learned a lot about what works and doesn't when it comes to public transportation. I particularly appreciated his insight, explored in the first edition, that any transit system faces a tradeoff between frequency, coverage area, and the ol' budget. Since I've already used those insights to analyze Cedar Rapids transit, and since I had cause to be in Minneapolis this week, it's a chance to examine Walker's ideas in light of the Twin Cities' Metro Transit, a system with which I'm relatively unfamiliar. As it happens, Walker consulted in the Twin Cities, albeit quite a few years ago (Walker 2009).

The fundamental problem addressed in Human Transit is how to move large numbers of people within a small space. Walker refers in the introduction to three efficiencies of transit over cars--space, labor (one driver for many passengers), and strain on the environment (2023: 15)--and pollution, climate, and public health concerns get a few mentions elsewhere in the book, but essentially we're asking how to make the transit we can afford work for the people we've got. It takes as written the aggregation advantages of cities, and that people are living in dense metros for those very advantages.

Twin Cities transit map
Metro Transit system map

Even in densely-populated cities, most people must have positive reasons to take transit. Walker focuses on seven common "demands" (expectations) in ch 2:

(1) Connectivity. Are the stops convenient enough to my home and destinations that I can leave the car in the garage or not have a car at all? If I can't get where I'm going on a single line--unlikely in an efficient system consisting of multiple straight lines--are connections easy to manage? 

This is especially hard for a tourist to judge. We stayed at the Graduate Hotel, three blocks from the University of Minnesota's main campus, and kitty-corner from the East Bank station on the light-rail Green Line. We took the Green Line east to the A-Line BRT, then rode that line south to Grand Avenue, at the entrance of Macalester College. The transfer to the A-Line was a bit tricky, as it involved walking swiftly across both University and Snelling, both wide and heavily trafficked streets, to get to the bus stop. 

busy intersection, cars, old buildings
View from the bus stop on an A-Line;
despite the important transit junction, the area is noticeably rundown

On the way back, we took the #63 bus to meet the Green Line at Raymond Avenue. It was not noticeably longer than the journey there, particularly because the train came almost as soon as we got off the bus.

(2) Span and frequency (covered in ch 8). Does the system run enough of the day that I can get to work or school and maybe evening events?

The first St. Paul-bound train on the Green Line rolls through East Bank at 5:21 a.m. Trains come every 15 minutes beginning at 6, only slowing down at 10:30 p.m. The last train arrives at 11:36. Saturday and Sunday schedules are pretty similar.

Bruce Nesmith with a statue of Tony Oliva
In 2016 I took the Green Line to its terminus at Target Field where I ran into Tony Oliva

The A-line has a longer day, with the first southbound bus at Snelling and University at 4:15 a.m. and the last at 12:15 a.m. The first #63 bus arrives at Snelling and Grand at 5:15 a.m. and the last at 1:15 a.m., running every 15 minutes from morning through evening rush hour. The different start/end times are curious.

(3) Time. How long does it take to get where I'm going, including and maybe especially the time to get to the station and wait for the bus or train to arrive?

According to Google Maps, it takes 33 minutes in mid-afternoon to get from our hotel to the Macalester College campus by transit, as opposed to 14 by car. If we add in an average wait time of 7.5 minutes for the train, we're at 40.5, plus managing the transit. We got to the East Bank light-rail station just as a train was pulling out, so we waited the full 15. We had about 7 minutes on Snelling Avenue once we'd navigated the intersection, though it seemed longer in the scruffy surroundings, so the total was about 45 minutes.

sign says next train in 11 minutes
Waiting for the train at East Bank

A 45 minute transit run in lieu of a 14 minute drive was still worth it for me, the tourist, because I didn't have to deal with traffic and parking. But if I worked at or near Macalester, I'd probably have my own parking space. (In Washington, D.C., by comparison, the transit time to car time ratio outside of rush hour is maybe 2-1 instead of 3-1.)

(4) Fares (ch 11). How painless is it to pay to ride? For regular riders, there are 7-day and 31-day options which can be loaded onto one's plastic Go-To Card. For tourists, an all-day pass is $5, good for both rush hour and non-rush hour, and usable on all local lines. (A single ride is $2.50 during rush hour, $2 otherwise.) 

I bought my all-day pass on the Metro Transit app, so it was on my phone, while Jane bought a paper ticket at the East Bank station. 

Fare kiosks by the train stop
Fare kiosks

The all-day pass allowed us to transfer without additional payment, and to stop on the way back at the Textile Center across from the Prospect Park train stop. Our different modes of ticket purchases were about equally painless...

all-day pass and credit card receipt
All day passes are $5 on weekdays, $4 on weekends

...but anyhow fare collection on Metro Transit appears to be on the honor system. If you have a Go-To Card you can tap in at the station, but you can't do that with phone or paper; anyhow there's no barrier to prevent non-payers from entering the vehicles.

(5) Civility, mainly of station agents and conductors, but I'd include conditions on the bus or train. Because of the seemingly lax enforcement, we had no interactions with transit employees. Conditions on the vehicles we rode Friday (three separate light-rail trains, one A-line bus, one #63 bus) were a mixed bag. 

Interior, eastbound light rail train

None of the vehicles was crowded, as we did start our travels til after 9:00 a.m. There was a strong marijuana smell on two of the trains, and one train had several passengers who were clearly living temporarily in the train cars. Saturday night on my way back to the hotel on the Green Line, I unwittingly boarded into a drug party that was well underway; I debarked as soon as I could, and trotted to the next car which proved to be a better fit.

(6) Reliability. Can I count on the system to get me where I'm going on time? The vehicles were all on time or very close to it, even though we heard announcements that the Green Line was running slowly due to track issues.

(7) Legibility. If I change my plans at the last minute, is it clear what my new route is? I'd use the Maps app on my phone rather than try to use system resources, whatever city I was in. There aren't system maps about in the Twin Cities, or even route maps for the light rail or BRT. 

sign posted with bus times
Grand Avenue and Snelling: when the bus comes

From my quick tourist's glance, it seems Minneapolis-St. Paul's Metro Transit is doing a lot of things right. The system is easy to use, and mostly comfortable to ride. Even so, for our Saturday tourism, we used our car. Getting there in a-third of the time is irresistible, even for urbanists.

SEE ALSO: 

Ian Guide, "We Need to Talk About Bus Rapid Transit Creep," Streets.mn, 12 March 2024 [The A-line BRT is not BRT. It shares lanes with private cars, and stops at traffic lights. The only way it's special is it makes fewer stops than an ordinary bus, which makes it an express bus, not BRT. On the other hand, the University circulators, one of which I took Saturday night, run much of their route along a "transitway" that is closed to private cars.]
 
Diana Ionescu, "How Public Transit Became Political," Planetizen, 14 March 2024 [includes article to longer article in Governing]
 
 
bus approaching East Bank light rail stop
Washington Avenue: Both metro and university buses drive along the light rail track,
which is ever-so-gently separated from the street

Wednesday, March 13, 2024

FY25 budget

President Biden released the Budget of the United States this week, directly on his State of the Union address last week. The Budget has been a presidential responsibility since 1921, when Congress essentially threw up its collective hands and delegated it to President Warren G. Harding in the Budget Act. Presidents got a significant staffing upgrade relative to this task in 1970, when another Budget Act created the Office of Management and Budget directly responsible to the chief executive.

This edition of the budget is for fiscal year 2025, which begins this coming October 1. It comes somewhat later in the calendar than usual, but otherwise is pretty typical for a budget. It's mostly a continuation of past government financing, with some policy recommendations that would if adopted have some impact on the bottom line numbers. It has no policy authority of its own; actual government financing requires appropriations by Congress, which given its divided and polarized condition tends even more towards the incremental. Still, it's as good a statement as any of the financial shape and direction of the U.S.

Biden's budget projects a country returning to normal over its 10-year time perspective, following the dislocations of the coronavirus pandemic shutdowns--dislocations that were profound but seem to have been mercifully short-lived. Real GDP growth is expected to be in the low 2 percents through fiscal 2034 (Table S-9, p. 173). (It is a real temptation for presidents to forecast exceptional economic growth, because it makes the bottom line look better. Trump did this; Biden hasn't, to his credit.) Inflation is projected to be down to 2.3 percent in 2025 and in the low 2 percents after that. Entitlement ("mandatory") spending is predicted to be stable at 15-16 percent of gross domestic product, with interest payments rising to 3.5 percent of GDP over this period (Table S-5, p. 142).

Government revenues have averaged about 18 percent of GDP since the 1970s, though they dropped sharply during the 2008-10 recession and the pandemic. FY25 revenues are estimated to be 18.7 percent, with gradual rises after that to 20+ percent beginning in FY31 (Table S-1, p. 137). Biden proposes tax increases on "the wealthiest Americans and big corporations" totaling $5 trillion over this period, not to mention allowing most of the 2017 tax cuts to expire when they sunset in 2025.

Government spending has averaged about 21 percent of GDP since the 1970s, running higher during the recession and then surging over 30 percent at the height of the pandemic. FY25 spending is estimated at 24.8 percent, remaining between 24 and 25 percent for the rest of the period (Table S-1, p. 137). It will top $7 trillion for the first time, and reaching $10 trillion in FY33--consistent with growth in the size of the economy, but staggering numbers for someone who remembers Jimmy Carter getting static for proposing the first $500 billion budget. (Now the defense budget alone is more than half-again larger!) There are a few new spending programs included, such as "investments" in health care and expanding access to child care and early childhood education. More notably, the budget projects no cuts in Social Security or Medicare, the two largest and fastest-growing government programs, and declining demands on the defense budget.

The FY25 budget projects a FY25 deficit of $1.781 trillion, 6.1 percent of GDP, optimistically assuming adoption of his proposals and seemingly peace in the Middle East and Ukraine. Otherwise the deficit remains over 5 percent of GDP (Table S-2, p. 138), or gets higher if the 2017 tax cuts are extended. I understand that you don't want to be so aggressive about the deficit that you blow up the economy, and that none of the most-feared negative effects--crowding the private sector out of lending markets, vulnerability in a crisis, vulnerability to international creditors--has come to pass after 40 years of high borrowing. 

 But neither am I sanguine about our financial future. Maybe I'm too Newtonian but the lack of urgency shown by either party when they're in power seems less than resilient. But on the other hand, is rationalizing the budget more urgent than cleaning up forever chemicals or burying interstates or getting the health insurance system on a sound footing?

SEE ALSO:

James Capretta, "The Biden Administration's 2025 Budget," AEIdeas, 12 March 2024

Anna Malinovskaya and Louise Sheiner, "The Hutchins Center Explains: Federal Budget Basics," Brookings Institution, 13 December 2018 [lots of good if out-of-date charts here]

Michael E. O'Hanlon and Alejandra Rocha, "What's in Biden's $850-Billion Defense Budget Proposal?," Brookings Institution, 15 March 2024

Alan Rappeport, "Biden Budget Lays Out Economic Battle Lines with Trump," New York Times, 12 March 2024

Monday, March 11, 2024

10th Anniversary Post: The Gentrification Conundrum Revisited

Census tract 27: Row houses built in 2017 with appraised
values of $400,000+

Ten years ago this month, Holy Mountain looked at gentrification, the value of diversity, minimum wage laws, the city's new strategic plan Envision CR, as well as Indian Creek Nature Center's annual Maple Syrup Festival--which happens again in a couple weeks! We will be there to cover every sticky bite, of course.

The piece on gentrification, driven by the middle class's return to cities, surveyed an array of literature both pro and anti. (For other surveys of that array, see Cortright 2014a, Cortright 2014b, and Kaplan 2015.) It also introduced me to Chicago artist Theora Kvitka, whose cartoon I got permission to use at the top of the post.

Gentrification at its worst involves under-invested urban neighborhoods receiving a sudden influx of middle class residents that dislocate the people already living there, who are often working class people of color. (In Alyssa Cole's novel When No One is Watching [Temple Hill, 2020], the newly-arrived whites in a New York City neighborhood not only displace the black residents and yuppify their stores, they capture the blacks and use them for scientific experiments.) But as Joe Cortright has argued, the alternative to gentrification for most neighborhoods has not been humble stability but concentrated high poverty. So, the goal for policy makers should be to encourage investment without blowing up places where people are already living.

I wrote in 2014:

For the older neighborhoods in Cedar Rapids, such as Wellington Heights and the Taylor Area, I've advocated "gentle gentrification," of which I'll admit I have only the very vaguest concept. But this much is certain: We don't build diverse communities by pricing people out of the homes they own. It's difficult enough to overcome habits of class prejudice and segregation without adding a financial hit.

Cedar Rapids is not New York City or D.C. or Denver, but we too have seen changes. Data from the U.S. Census Bureau's American Communities Survey bear out some of those impressions, and although it's not clear how much of these changes are due to movement in and out, there are new poor areas developing at the edges of town.

Several census tracts exist mostly in core neighborhoods, although they do not correspond exactly to neighborhood boundaries.

map of census tracts in Cedar Rapids
Census tracts in the center of Cedar Rapids
(Sources: census.gov)

Data are from the 2000 U.S. Census, and the American Community Survey's five-year estimates published in 2014 and 2022 (so the data center on 2012 and 2020). See table at bottom of post for raw numbers. Note that none of these tracts became whiter between 2000 and 2020.

HARD HIT: Population DOWN, Income DOWN, Poverty UP

Census tract 19: Downtown, with portions of Mound View and Wellington Heights

Population -22.5%, Median Family Income +6.9%, Poverty Rate +69.3%

There's been some condo development downtown, with more under construction, which may account for the jump in income since 2010 (though to keep pace with inflation since 2000, median income would have to be about $47000). There are also some rooming houses in the MedQuarter, and some older housing stock in the neighborhoods in areas that remain poor. The low poverty rate from 2000 relative to today surprises me, because what housing stock we've lost was rickety (around Coe College, for example).

Of the six tracts studied here, this tract has diversified the most, going from 80.2 percent white (not Hispanic or Latino) in 2000 to 62.7 percent in 2018-22.

GENTRIFICATION COMING? Population DOWN, Income STEADY, Poverty UP or DOWN

Census tract 12: including Time-Check

Population -46.7%, Median Family Income +84.7%, Poverty Rate +114.9%

Census tract 26: including Czech Village 

Population -30.2%, Median Family Income +171.4%, Poverty Rate -33.8%

These areas lost much of their housing after the flood, with the city buying out property owners and leveling the houses between C Street SW/Ellis Boulevard NW and the Cedar River. Now that flood protection is being built on the west side of the river, expect construction to begin in earnest. It will be interesting to watch this over the next several years. Note the contrast with nearby tract #22 to the north in terms of economics away from the river.
 
These were the two whitest tracts in 2000, with over 92 percent white (not Hispanic or Latino). Tract #12 remains 87.5 percent white, while tract #26 has diversified somewhat to 77.8 percent white.

GENTRIFICATION STARTED? Population and Income STEADY, Poverty UP

Census tract 22: most of the Taylor Area including Kingston

Population -6.2%, Median Family Income +35.4%, Poverty Rate +124.1%

Kingston Yard four story brick building next to sidewalk
Coming to tract #22: apartment/condo development at Kingston Yard

This area has almost made back the population lost to flood displacement. The jump in income results from burgeoning condo development near the Cedar River, which before the flood was mostly older shops with some housing. (Note, however, incomes still lag inflation, which was +50 percent nationally from 2000-2020.) Because of the flood, this area was mostly vacant in 2010-14, so any displacement had already happened before the new residents arrived. The high poverty rate is probably located in the blocks farther from the river; its persistence is striking, suggesting that area has not shared in the prosperity brought by recent development. Why it is so much higher than 2000, I do not know.

Census tract #22 has diversified considerably, from 86.5 percent white (not Hispanic or Latino) in 2000 to 63.6 percent in 2018-2022.

LOOKS LIKE GENTRIFICATION: Population STEADY, Incomes UP, Poverty DOWN

Census tract 17: including most of Wellington Heights

Population -3.4%, Median Family Income +107.3%, Poverty Rate -45.0%

Census tract 27: most of Oakhill Jackson including New Bohemia

Population +5.8%, Median Family Income +113.9%, Poverty Rate -10.6%

Wellington Heights, largely untouched by the 2008 flood, has seen some housing investment since 2010, but I still can't explain that phenomenal jump in income or decline in poverty. The eastern border of Wellington Heights is 19th Street SE, but the census tract extends another half-mile farther to Forest Drive, taking in a considerable portion of a well-to-do area (including the home base of Holy Mountain). Maybe that explains the numbers, or maybe it is indeed an indicator of gentrification of the older area.

Oakhill Jackson has made back the population lost to flood displacement, and a little extra, though the U.S. as a whole gained nearly 18 percent during this period. The surge in income results both from burgeoning condo development near the Cedar River and middle class influx into the working class area farther in. Of the four neighborhoods this looks the most like stereotypical displacement accompanying gentrification, although the poverty rate remains high so not all the poor have been displaced. 

Census tract #27 was the most racially diverse of the six tracts in both 2000 (65.9 percent white not Hispanic or Latino) and 2020 (59.8 percent white). Tract #17 has diversified from 78.6 percent to 67.7 percent white.

Kristen Jeffers speaking
Kristen Jeffers (from theblackurbanist.com)

Planner Kristen Jeffers, who blogs at The Black Urbanist, just produced an hour-long video called "Six Ways to Defy Gentrification." She describes gentrification, with decidedly negative connotations, as both an economic process ("typically accompanied by displacement") and a cultural process by which neighborhoods become more "respectable" (because previous residents were considered "unwealthy or unworthy" or both). Three of the six pieces of advice, directed at those experiencing gentrification from a less powerful perspective, are:

  1. have faith in yourself (30:00): "you are worthy, you are valid, no matter what your rent is"
  2. ground yourself by cultivating your art (32:00), particularly cultures and folkways like music, fabric or other visual art, gardening, teaching, &c., as well as cultivating your community and your resources
  3. ground yourself through finding every way to make life convenient for yourself (33:45) by inhabiting your neighborhood: walking to the local grocery store, doctor's office, school, &c.

For gentrifiers, she commends:

  1. care about the people around you (41:00), "be that person" who contributes to a diverse community by working and playing together
  2. infrastructure (42:55), including public transportation and pedestrian plazas, but particularly housing that is affordable/accessible for everyone
  3. access (46:15) for people with mobility needs, including everyone in those conversations

Cedar Rapids is growing slowly enough that we ought to be able to manage gentle gentrification, increasing investments in core neighborhoods without dislocating existing residents. I think everybody ought to live as close to the city center as they can, and that services ought to be available within a reasonable distance that makes walking, wheeling, cycling, and public transit viable alternatives. I also think there should be room for everyone, and that the fate of those with fewer resources and/or socially marginalized is the concern of everyone. I see things we're doing right--two-way streets, park development, zoning reform, a flurry of apartment and condo construction in the core--and things we're doing wrong--drive-to urbanism and big "game-changer" projects that don't serve everyday needs or leave room for everyday lives. Could we be doing all this better?

SEE ALSO: 

Pete Saunders, "Rethinking the Affordable Housing Crisis, Part III," The Corner Side Yard, 6 March 2024
Steven Thomson, "As 'Gentrification' Turns 50, Tracing Its Nebulous History," Curbed, 5 November 2014

DATA:


TRACT POP00 POP12 POP20 POP 00-20 MF00 MFI12 MFI20 MFI 00-20
12TimeCh 3215 1362 1715 -46.70% 40451 38365 74722 84.70%
17Wellington 7137 6598 6891 -3.40% 55613 72639 115293 107.30%
19Downtown 3359 2850 2603 -22.50% 31182 28188 33333 6.90%
22Kingston 2779 2259 2606 -6.20% 37946 33304 51364 35.40%
26CzechV 3012 2725 2101 -30.20% 42703 58100 73185 71.40%
27Oakhill 1797 1591 1902 5.80% 27115 40543 58004 113.90%


TRACT POV00 POV12 POV20 POV 00-20


12TimeCh 0.087 0.179 0.187 114.90%


17Wellington 0.149 0.103 0.082 -45%


19Downtown 0.225 0.375 0.381 69.30%


22Kingston 0.116 0.293 0.26 124.10%


26CzechV 0.154 0.174 0.102 -33.80%


27Oakhill 0.282 0.368 0.252 -10.60%


Iowa and the vision thing

Brenna Bird, Iowa Attorney General Iowa's legislative session ended this week, and there's not much to say about its efforts that I ...